
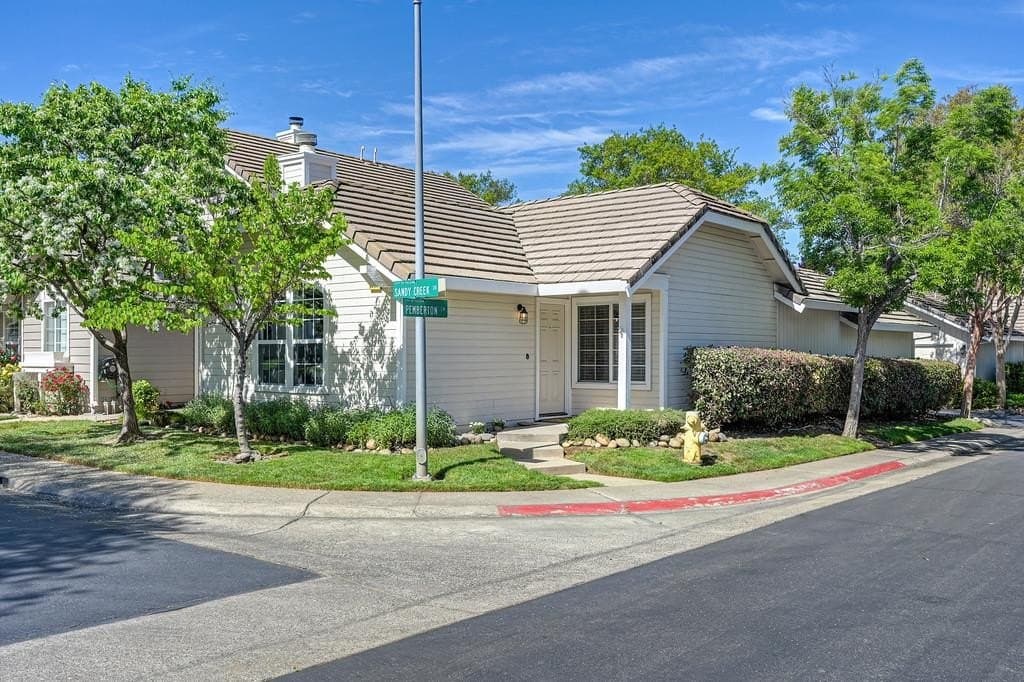
$499,000
1141 Sandy Creek Dr
Folsom, CA
2 bd2 ba1,020 sqft$489/ft²
House2,762 sqft lot
View photos & details
Brokers — List your Company Here
Featured local agent — Folsom, CA
Compass Real Estate · Folsom, CA
“Your trusted relocation specialist since 2009. 350+ homes sold. Zero-pressure, data-first approach.”
This spot is open. Be the only brokerage featured on this page — one slot, no auction.
Claim this spot* Example only — dummy agent for illustration. Your logo, name, tagline, link, and lead routing replace this content.
Housing market overview · Updated monthly ·
$725,000median sale price
The median home sale price in Folsom, CA is $725,000, down 10.5% year-over-year. Homes sell in an average of 14 days with 156 active listings. The market is currently a seller's market. (Source: Redfin monthly MLS data, as of May 2026 — the most recent Redfin release; Redfin publishes each month's data on a ~6-week lag.)
Folsom, CA is currently a seller's market, based on 1.9 months of supply and homes selling in about 14 days. How we determine this →
Homes sold
81
Last 12 weeks
Days on market
14
Fast-moving
Active listings
156
1.9 months supply
Sale-to-list
99.7%
Below asking
| Metric | Value |
|---|---|
| Median sale price | $725,000 |
| Median list price | $750,000 |
| Year-over-year price change | -10.5% |
| Average days on market | 14 days |
| Active inventory | 156 listings |
| Months of supply | 1.9 months |
| Sale-to-list price ratio | 99.7% |
| Median price per sq ft | $386/sq ft |
| Homes sold (latest month) | 81 |
| New listings (latest month) | 107 |
| Listings with a price cut | 41.7% |
| Market condition | Seller's market |
Source: Redfin · Updated monthly
How the Folsom, CA market breaks down across single-family homes, condos, and townhouses.
| Property type | Median price | Price / sq ft | Homes sold | Days on market |
|---|---|---|---|---|
| Single-family | $741,000 | $390/sq ft | 73 | 13 days |
| Condo / Co-op | $521,000 | $355/sq ft | 7 | 56 days |
| Townhouse | $463,000 | $343/sq ft | 1 | 3 days |
Source: Redfin · Updated monthly
The Folsom housing market is currently classified as a seller's market with a median sale price of $725,000. Prices have fallen 10.5% compared to last year, with homes spending an average of 14 days on market, indicating 1.9 months of inventory.With limited inventory, homes sell quickly and buyers should be prepared to act decisively and competitively to secure a property.The price-to-income ratio of 5.5x provides context for how home values compare to local earning capacity.
There are currently 156 homes listed for sale in Folsom, California. The median listing price is $750K. Featured listings range from $499,000 to $2,849,950.
Folsom, CA
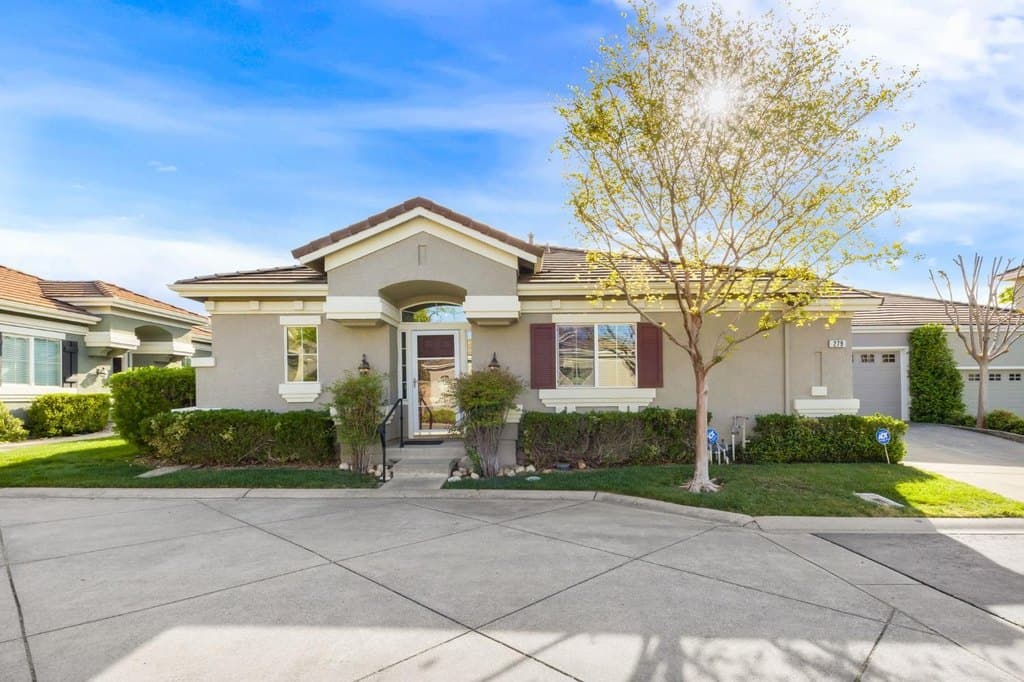
Folsom, CA
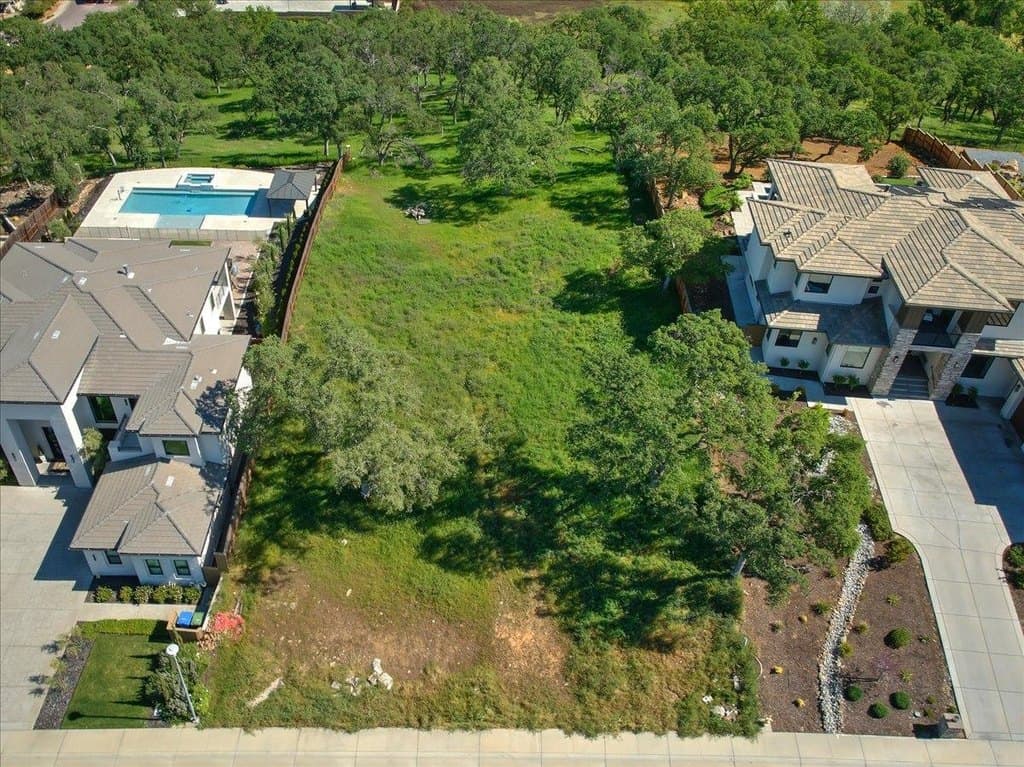
Folsom, CA
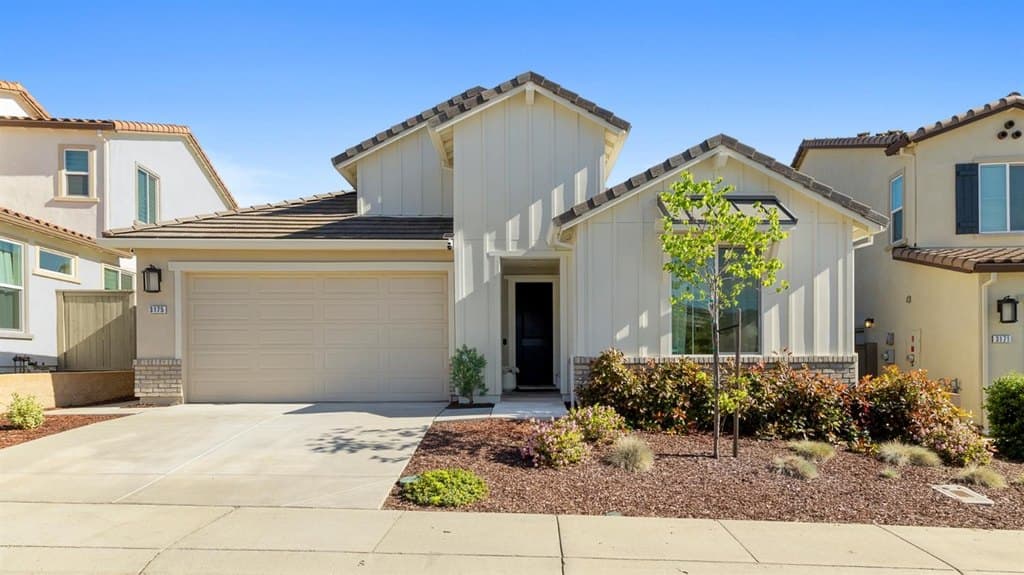
Folsom, CA
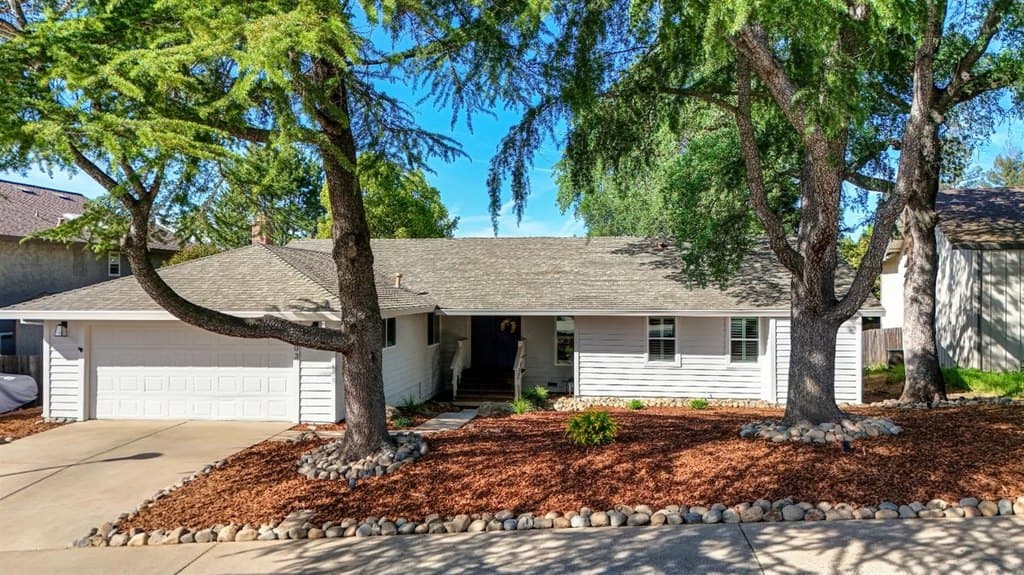
Folsom, CA
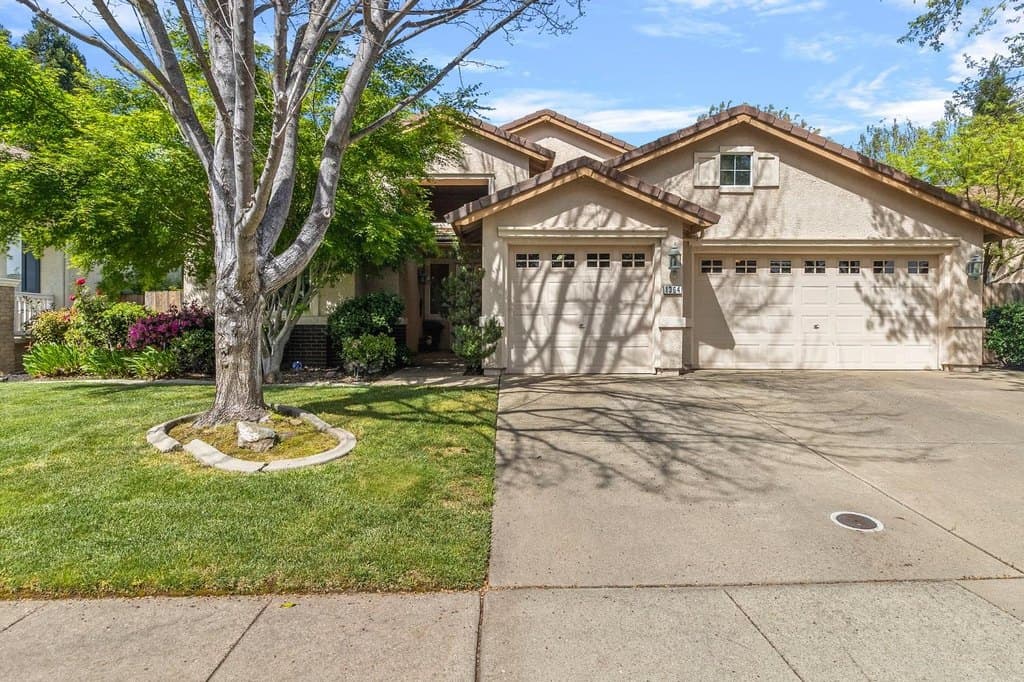
Folsom, CA
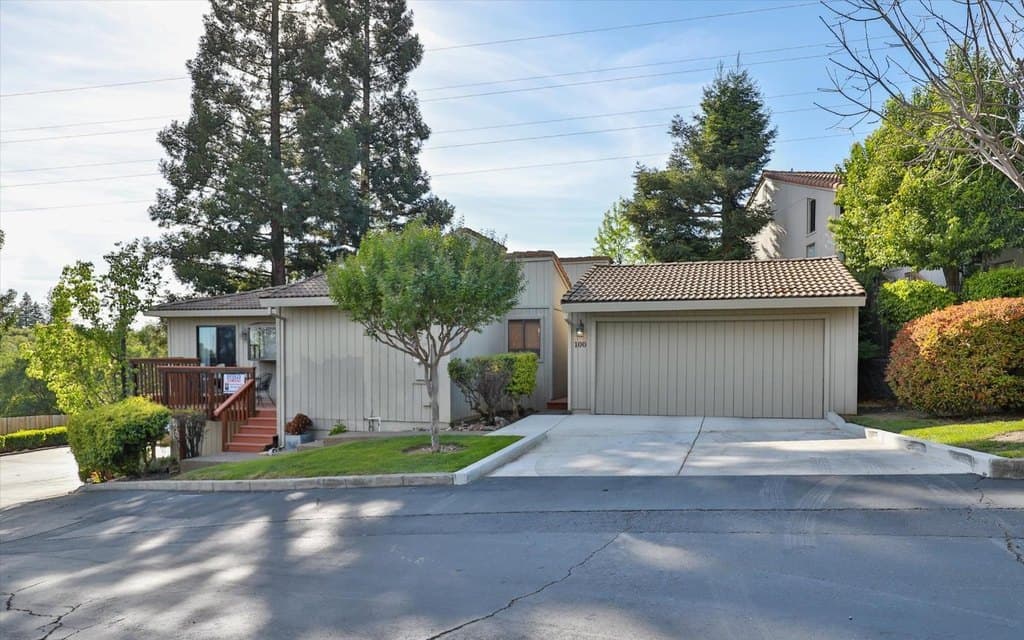
Folsom, CA
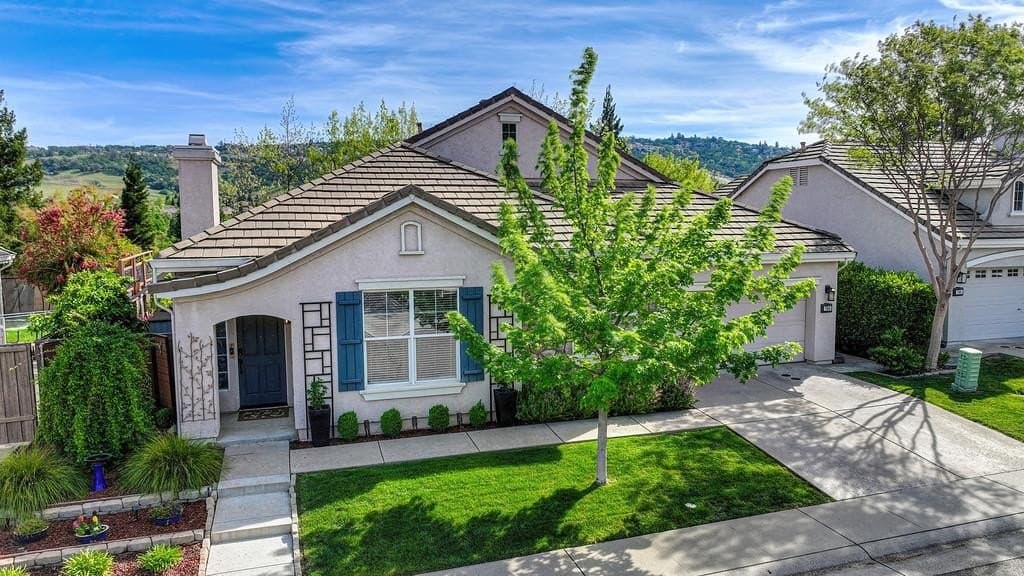
Folsom, CA
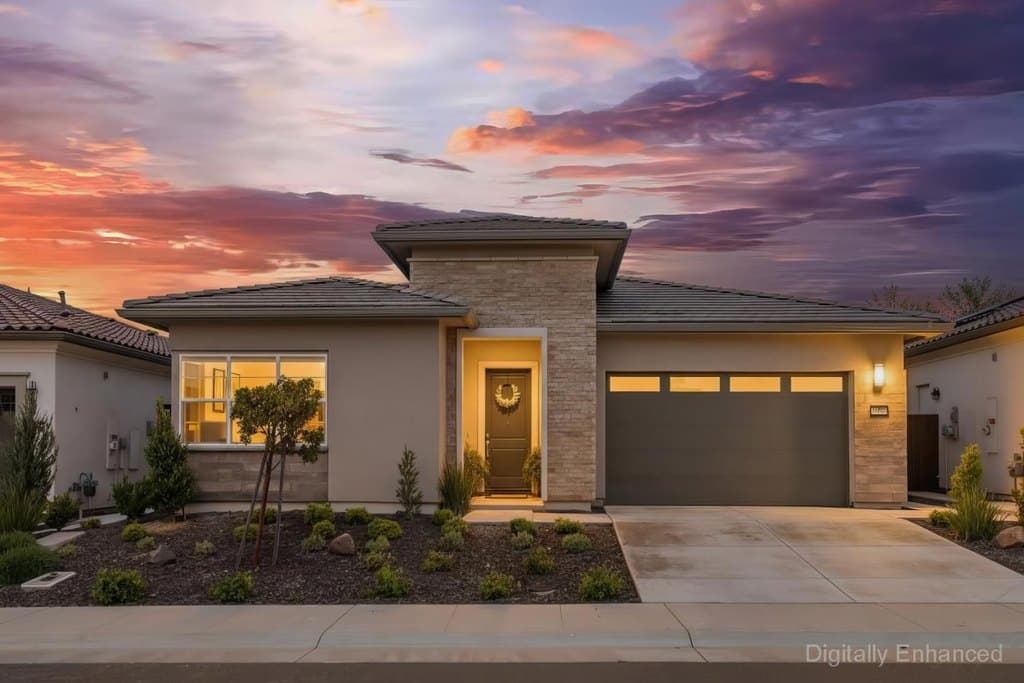
Folsom, CA
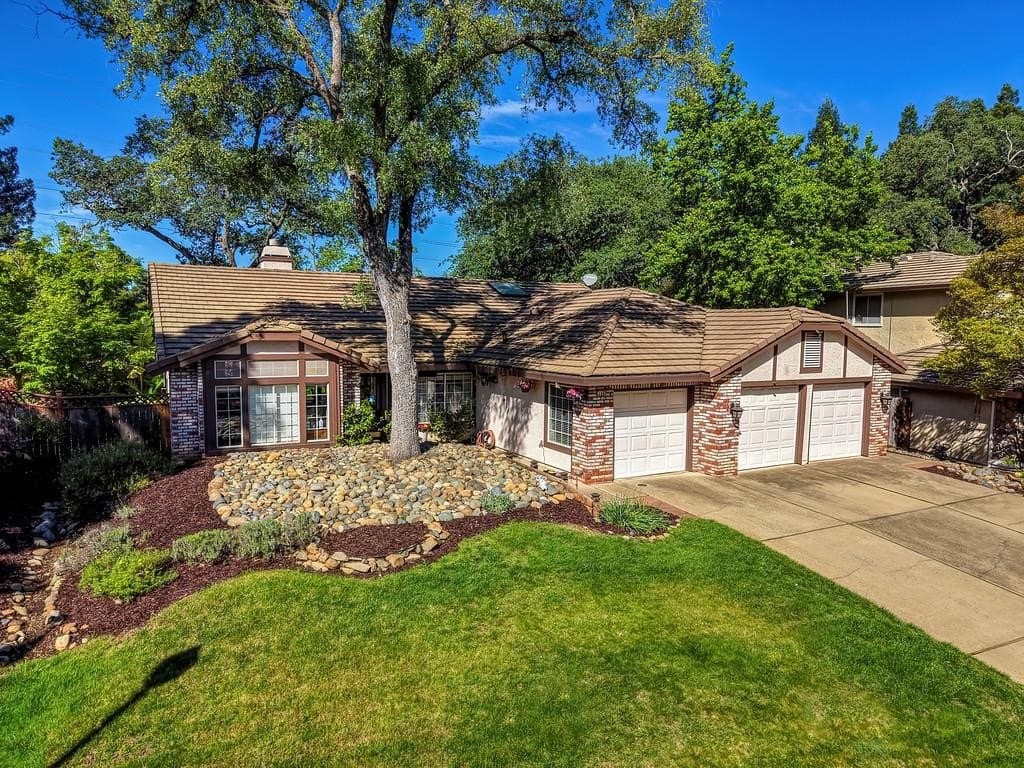
Folsom, CA
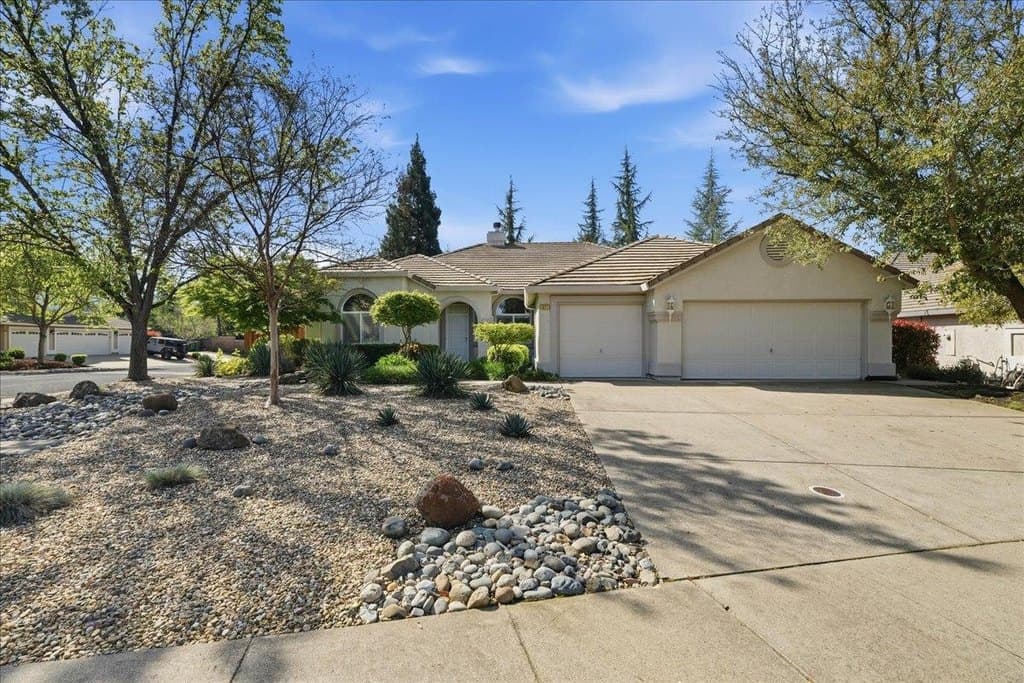
Folsom, CA

Folsom, CA
Get connected with a local real estate expert — free, no obligation.
Active listings
156
Homes on market
Median list price
$750K
Avg. days on market
14
Days until sale
New this week
107
Newly listed
Population
82,140
Median income
$139,263/yr
Median age
40.4 years
Owner-occupied
69.0%
College grads
54.7%
Avg commute
25.5 min
Source: U.S. Census Bureau ACS
Zillow home value
$765,104
Zillow rent index
$2,669/mo
Price-to-rent ratio
23.9x
Price-to-income
5.5x
Source: Zillow Research
Folsom is a community of approximately 82K residents with a median age of 40.4 years.The median household income is $139,263, which reflects a relatively affluent area with strong earning potential. 54.7% of residents hold a bachelor's degree or higher, indicating a highly educated population.
Homeownership rates are at 69.0%, reflecting strong community stability and long-term resident commitment. The average commute time is 25.5 minutes, which makes this an excellent choice for those seeking short commutes to employment centers.Overall, Folsom offers a balanced lifestyle with accessible home values relative to local income levels.
16 schools tracked · 13,179 students
The largest public schools serving Folsom, CA by enrollment, drawn from the National Center for Education Statistics. School quality is a commonly cited factor in home-buying decisions — these are the campuses families in this area are most likely to encounter.
Folsom High
Grades 9-12 · 2,806 students
Vista del Lago High
Grades 9-12 · 1,750 students
Sutter Middle
Grades 6-8 · 1,628 students
Folsom Middle
Grades 6-8 · 1,403 students
Mangini Ranch Elementary
Grades K-5 · 656 students
Theodore Judah Elementary
Grades K-5 · 626 students
Russell Ranch Elementary
Grades K-5 · 609 students
Gold Ridge Elementary
Grades K-5 · 535 students
Source: National Center for Education Statistics, Common Core of Data directory. Updated annually. Ratings and test scores are not currently displayed.
Want a head-to-head view? Compare Folsom side-by-side with any other U.S. city using our market-comparison tool.
For investors evaluating Folsom, the price-to-rent ratio of 23.9x indicates higher purchase prices relative to rental income, typical of appreciation-focused markets. The market has softened 10.5% year-over-year, potentially creating entry opportunities for strategic buyers.Use our rent vs. buy calculator to analyze whether owning or renting makes more financial sense based on Folsom's current market conditions and your specific situation. Estimate your monthly payment with the mortgage calculator using Folsom's median home price.
The median home sale price in Folsom is $725,000, down 10.5% from last year.
Homes typically spend 14 days on market before going under contract.
The median household income is $139,263 per year.
With 1.9 months of supply, Folsom is currently a seller's market.
There are currently 156 homes listed for sale in Folsom, CA.
The Zillow Home Value Index (ZHVI) for Folsom is $765,104, representing the typical home value in the area.
The median condo/co-op sale price in Folsom, CA is $521,000, compared to $741,000 for a single-family home, based on the latest Redfin data.
The median single-family home price in Folsom, CA is $741,000 (about $390 per square foot).
Be the brokerage on this page
1 slot per pageYour logo, brokerage name, and direct link to your site — featured at the top of this page in front of every visitor researching this whole city. One brokerage, no rotation, no bidding war.
Weekly updates on prices, inventory, and trends. Free forever.